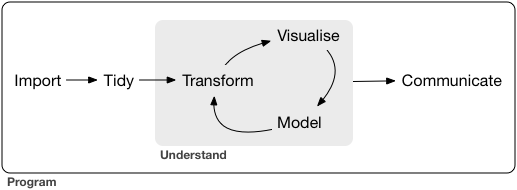
This is a non-exhaustive checklist of exploratory data analysis (EDA) checks I do for omics datasets + any associated demographic or meta-data, as a first step (after some basic reading in the data and basic preprocessing.) There are many resources for this. I am personally indebted to my Rafa Irizarry, Jeff Leek, Roger Peng, Karl Broman among others for many of these tips. Note that I tend to spend maybe 90% of total analysis time doing this kind of EDA and don’t usually start doing much modeling until I do at least an initial first pass of EDA and discuss results with the rest of the team and/or investigators who generated the data/provided the samples. See also Hadley Wickham’s diagram representing the data analytic process.
General tips
- Science tip: Make sure you understand the study design. Sometimes things aren’t totally clear until after the EDA though. Are there biological replicates, technical replicates, or both? What does “biological replicate” even mean? (Same person, different part of the tumor, but same date? Same person, different time? Same person, one measurement before treatment and one measurement after treatment?) Make sure you have the variables that will allow you to take the study design into consideration (eg may need a variable for “time point,” a variable for “individual” etc)
- Technical tip: If using R, always make sure you include NAs (for example, in the table function, this not the default - have to specify ‘useNA = “ifany”’)
Specific steps
- Check the number of samples, tabulate by all possible variables (such as case/control, disease type, sex, study site etc) - make sure there are no NAs there, make sure variables are standardized (eg not have M = Male = male, breast cancer = Breast cancer = Neoplasm, breast)
- Consider any crosstabulations that may make sense and may inform later analyses, for example case/control x study site, sex x SES, race x SES etc
- Check the ranges of the data matrix/matrices. Make sure there are no NAs here. If there are, try to figure out why (eg clinical data may be missing, but may aso have certain measurements above/below limit of detection, like in metabolomics or proteomics). Make sure that ranges all make sense (again, 0s can indicate value below limit of detection - need to figure out what to do with this before applying log transforms; if study is on adolescents, make sure that no one has age 1 or 30; make sure there are no weird codings for “missing data,” like 999 or -9 etc). Do this using both tables of quantiles and histograms.
- If you have NAs or 0s for the omics dataset, get an idea of how prevalent these are. Are there some samples that are mostly NA/0? Are there some metabolites that are NA/0 in a large fraction of samples? I’ve used the cutoff of 5% before i.e. only use metabolites that are > 0 in 95% of the samples and for those samples, replace the 0s with the smallest value above 0. That seems to work OK. If some metabolites are 0 in, say, 50% of the samples, you probably don’t want to use the (transformed) metabolite intensities as outcomes in a linear regression and need to decide on a different model (this may be OK if the metabolite is caffeine or cotinine, which is present in smokers, for example - not all metabolites will be present in everyone, but if you see this for creatine or glucose, there may be an issue)
- If there are clinical outcomes, make sure you understand them or how to calculate them. For example, if needed, make sure that you can calculate survival (so you have the appropriate dates and understand the censoring mechanism etc.)
- If anything has units, make sure you know what they are (eg is age in years or months?)
- Make sure you have data on batches or run order; if not, try to get those variables (for example, run dates for microarrays, run order for metabolomics data)
- Make boxplots, PCA plots (use scale=TRUE if using prcomp, which is not the default) of log-transformed omics features, ordering and/or color-coding by the various variables, especially batch/run order. This is probably the most important step in looking for possible artifacts/confounders. Note that even if there is no clear confounding by batch/run order, there could still be confounding by other variables due to sample collection/processing before the samples were actually run (for example, if cases were collected in one hospital and controls in another hospital.) Some people like to do hierarchical clustering here, I personally prefer PCA plots. Make sure the boxplots are before quantile normalization (QN), otherwise all the samples will all look the same (and we know that QN does not necessarily remove batch effects and could actually make it worse). Clear shifts by batch can be bad in boxplots, but I’ve also seen cases where the median goes down and the variance increases as the run order increases (so signal gets lower and messier) etc. Sometimes I’ll fit some regressions of PC1 and PC2 on the different variables - including the batch/run order variables - to get a better idea of what’s going on, but I don’t think that’s always necessary.