With the Coronavirus crisis currently being a global emergency, one question that has been asked over and over again is “What is the chance of dying if I contract this virus?” This is not an easy question to answer and we know that it depends on issues like an individual’s age (older individuals are much more likely to be affected than younger individuals) and how well a specific country’s healthcare system is working (including how overburdened it is during the current crisis). Nevertheless, it is still confusing to see how the death rates are varying between 1% in South Korea and over 8% in Italy (numbers from March 19, 2020).
In looking at death rates, is clear that the denominator – the number of individuals who are infected – is very susceptible to major differences between countries/regions, both in terms of the age distribution and in terms of who is getting tested – in Italy it is individuals who are more likely to be sick who are tested and in South Korea testing is more at random, leading to more asymptomatic individuals being tested, many of whom may never get truly sick (but can still transmit the disease) or are likely to only have a very mild illness. Because of this and the fact that Italy has a higher proportion of older individuals than South Korea (median age of 45.5 vs. 41.8), South Korea has a much higher proportion of positive tests among younger individuals.
Another – perhaps less appreciated – issue with estimating death rates is with the numerator: We know that an individual who eventually dies of Coronavirus will almost certainly not die right upon being diagnosed. Assume for example that we have tested all individuals and we know for certain that no one else will be infected in a certain community (perhaps because everyone is already infected!) We can count how many people have died by the time the last infection is caught and thus get an estimate of mortality. Should be fine, right? Well no… because it can still take weeks for infected individuals to actually die. I didn’t think about this myself, but others who work in this area did have been. Also, now when I look at the stats on Worldometers, I keep being struck by countries that have it mostly “under control” but where the rate of (new deaths)/(new cases) is very high. For example, on March 19, 2020 at 10:39 AM ET, there were 34 new cases reported in China and 8 new deaths – that’s a 25% fatality rate! Except it’s not, because clearly most (probably all) those new deaths are from previously diagnosed cases.
So I did the only thing I could in this case, in order to get a better grasp on what could be going on… I simulated some data. Here is a simulated population of 1,000,000 infected individuals who each have a 2% chance of dying from the disease. Since this is a random independent Bernoulli draw for each individual, the overall proportion will not be exactly 2%, but should be very close to it for such a big sample size:
## set the seed
## this makes you get the same results as me if you rerun this
set.seed(840526)
## population size
pop_size <- 10^6
## chance of dying for each individual
prob_death <- 2/100
## 0 if dies of coronavirus, 1 if does not die
pop_deaths <- rbinom(pop_size, 1, prob_death)
## basic check that the proportion of deaths is close to 2%
mean(pop_deaths)
## [1] 0.019794## save the number of deaths
## this way I don't have to keep calculating it later
number_deaths <- sum(pop_deaths) Next I simulated the survival time from Coronavirus. This is a super simple model where everyone gets infected at the same time, which is of course unrealistic. In the simulation, the 98% of individuals who will never die of Coronavirus have a survival time of infinity (they don’t live forever of course, but it doesn’t matter for this simulation), while the ones who do die have a survival time that is drawn from a Uniform(0,30) distribution, indicating that they can die at any point between 0 and 30 days (if there is a better distribution to use, please let me know and/or try it yourself):
## initialize survival time to infinity for everyone
surv_Covid <- rep(Inf, length=pop_size)
## change survival time for individuals:
## draw from a Uniform(0,30) for them
max_survival <- 30
surv_Covid[pop_deaths == 1] <- runif(number_deaths,
                                     0, max_survival)
## check the histogram
##  (infinite survival times are automatically excluded)
hist(surv_Covid, col = "grey",
     main="Survival time for individuals who die of Coronavirus",
xlab="Survival time (in days)") 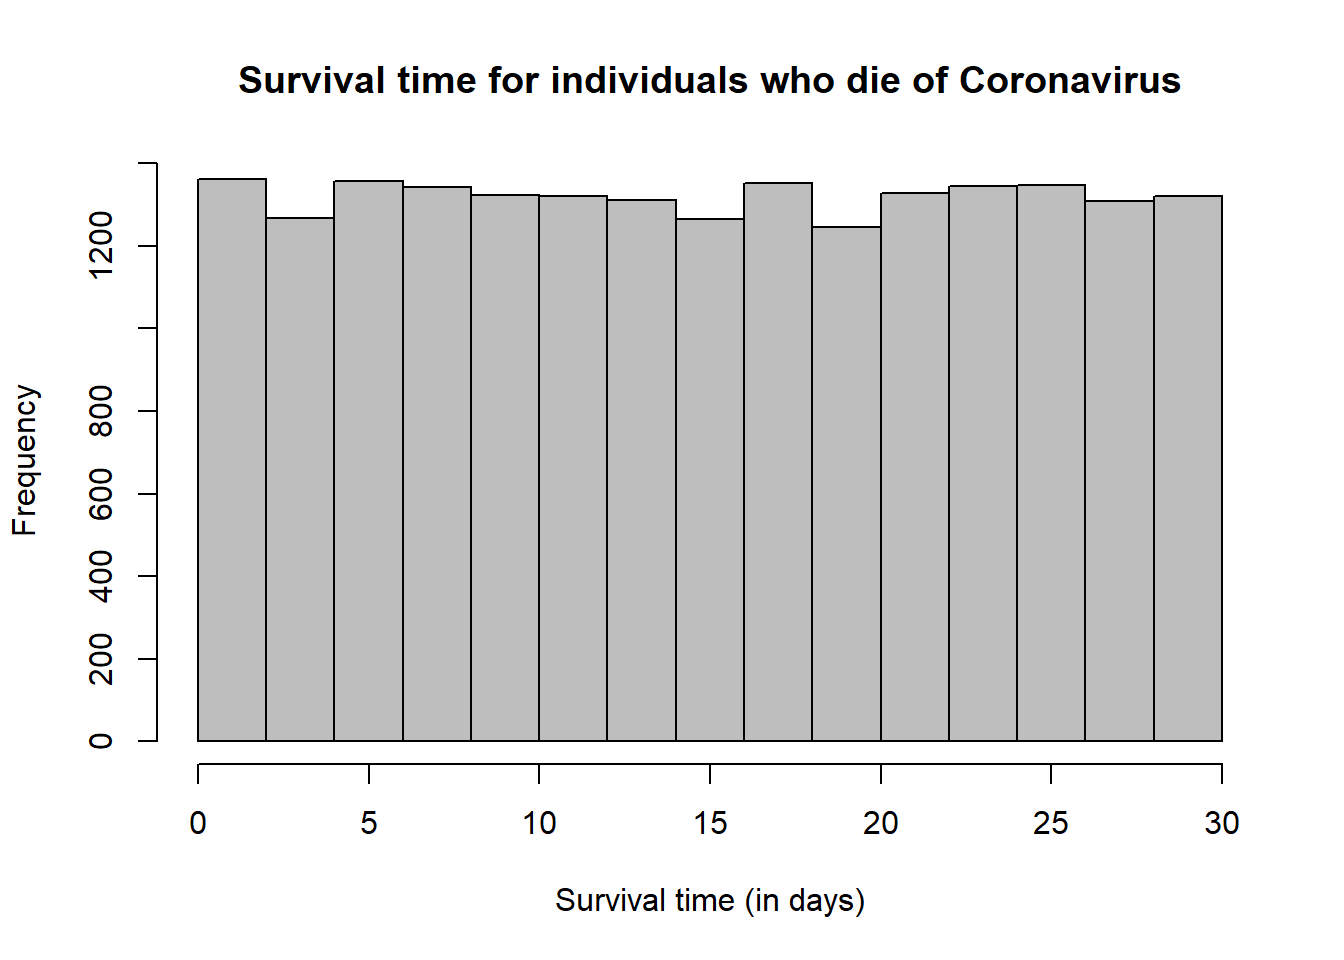
Let’s see what happens if we estimate the mortality at day 0, day 1, all the way up to day 30, assuming that everyone is tested on day 1. I’m lazy and I’m going to write a loop. If you’re offended by seeing a loop in R, then I apologize in advance.
## initialize mortality vector for each day (0-30)
mortality_by_day <- rep(NA, max_survival+1)
## calculate mortality by day in this population
for(day in 0:max_survival)
{
  mortality_by_day[day+1] <- sum(surv_Covid <= day)/pop_size
}
## make the plot of estimated mortality by day
plot(mortality_by_day,
     xlab = "Day",
     ylab = "Mortality estimate",
     main = "Mortality estimate by day")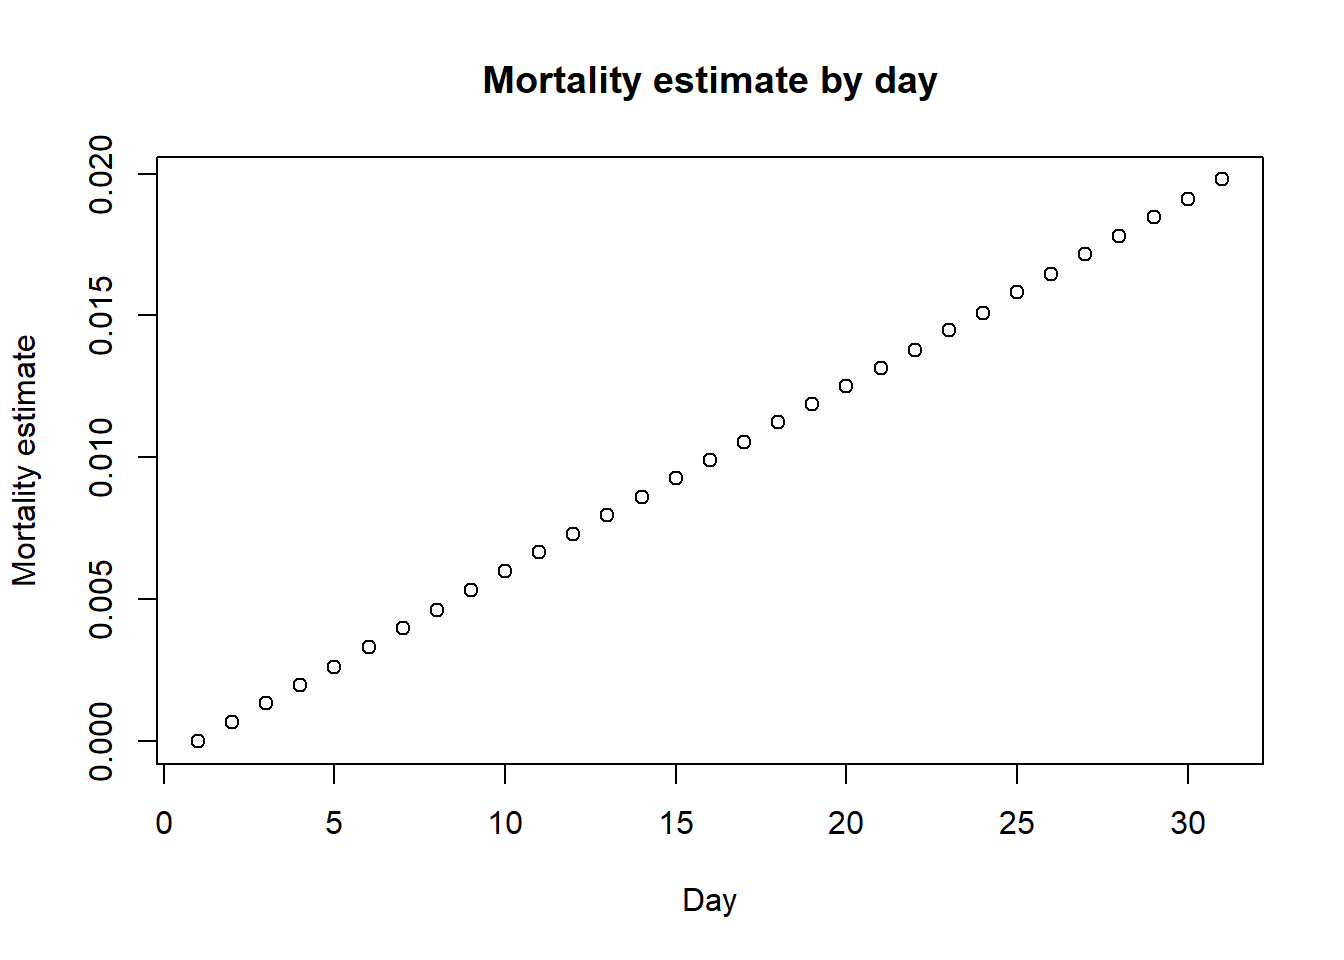
Of course, on day 30, the mortality estimate is very close to 2%, being exactly equal to the proportion of deaths. But if we look on day 3, the mortality estimate would be 0.2%. It actually increases almost linearly by day due to the uniform distribution we sampled from. Thus, we expect the death rates to increase even for countries like South Korea that did much more testing much earlier than the US, though they are still expected to be lower than in countries like Italy, whose healthcare system was massively overrun by the sudden large number of cases, even when adjusting for age.
As I said before, this is a highly simplified model and many other scenarios could be considered. Let’s consider one additional scenario where instead of testing everyone, we end up testing individuals who are sicker and more likely to die overall. Thus, suppose we’re testing 80% of the individuals who end up dying and 40% of the individuals who end up not dying.
## sample of tested individuals among those who do not die
tested_individuals_alive <-
  sample(which(pop_deaths==0),
         size = round(0.4*(pop_size-number_deaths)))
## number of such individuals
length(tested_individuals_alive)
## [1] 392082## sample of tested individuals among those who do die
tested_individuals_dead <-
sample(which(pop_deaths==1),
size = round(0.8*number_deaths))
## number of such individuals
length(tested_individuals_dead)## [1] 15835## all tested individuals
tested_individuals <- c(tested_individuals_alive,
tested_individuals_dead)
## deaths among all tested individuals
death_tested <- pop_deaths[tested_individuals]
## survival among all tested individuals
surv_Covid_tested <- surv_Covid[tested_individuals]
## number of tested individuals
pop_size_tested <- length(tested_individuals)In this case, we will not be including the individuals who die of Coronavirus but are never tested. This is likely to occur in reality for at least some individuals as well. Let’s look at the mortality estimates now:
## initialize mortality vector for each day (0-30)
mortality_by_day_subsample <- rep(NA, max_survival+1)
## calculate mortality by day in this population
for(day in 0:max_survival)
{
mortality_by_day_subsample[day+1] <-
sum(surv_Covid_tested <= day)/pop_size_tested
}
## make the plot of estimated mortality by day
plot(mortality_by_day_subsample,
xlab = "Day",
ylab = "Mortality estimate",
main = "Mortality estimate by day for tested subset")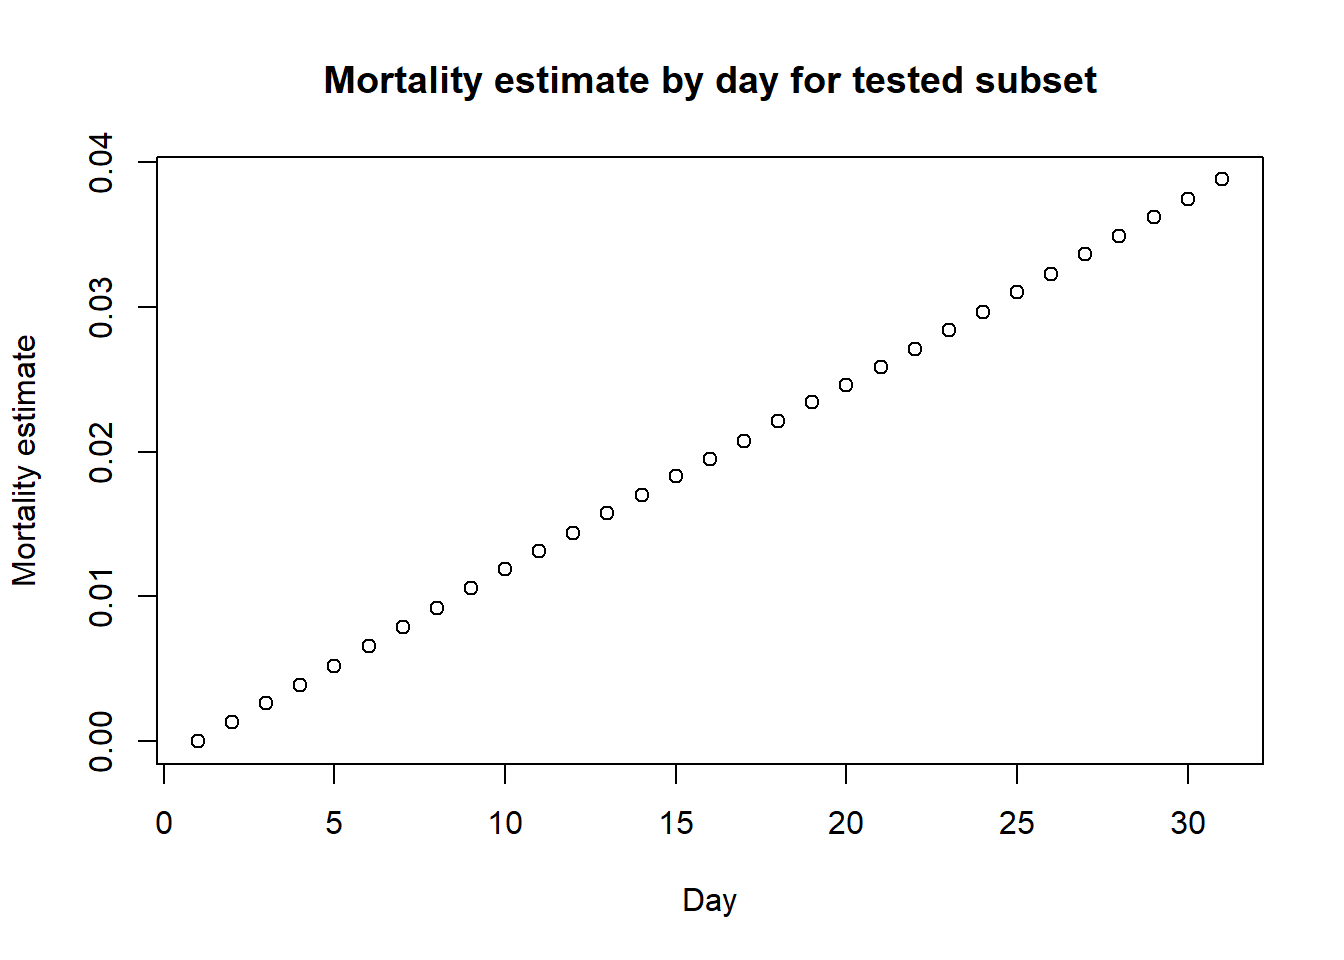 Note that the estimate at day 30 now is higher than the true value, being now
3.9%. So we can see that this is an overestimate, but it is hard to get a good estimate!
Note that the estimate at day 30 now is higher than the true value, being now
3.9%. So we can see that this is an overestimate, but it is hard to get a good estimate!
As I said repeatedly, these were all super simple models. I actually mostly coded them up to better understand what’s going on myself, but wanted to put them out in case they’re of help to others as well.